
16-07-2026
Beyond V50
Why critical component systems depend on statistical reliability, not just ultimate threshold performance.
An armor system is often judged by how it performs at the limits, in those rare and unpredictable moments where protection matters most. For decades, the V50 ballistic limit has served as the standard reference value for ballistic performance.
However, ballistic performance is inherently probabilistic, and V50 describes only the midpoint of a broader performance distribution. It does not indicate how an armor system protects across the full range of impact velocities, nor does it quantify the safety margin of the vest against the required threat levels.
To more adequately evaluate the safety margin, a single V50 midpoint value is not sufficient. What’s required is an understanding of the full probability distribution of perforation. That’s where S-curve analysis comes in.
V50 and the value of the full S-curve
V50 is defined as the impact velocity at which there is a 50 percent probability of complete perforation. This makes it a useful reference point when comparing the ballistic efficiency of different materials or armor configurations. But it doesn’t clearly show how reliably the armor will perform.
The shot outcome of ballistic limit testing produces either a complete perforation or a partial penetration across a range of velocities. This type of outcome data is typically called binary response data. What we are measuring is not a point, but a probability distribution.
To describe that behavior, we apply logistic regression to the full dataset. The probability of complete perforation is modeled as a function of impact velocity, resulting in a sigmoidal relationship known as the S-curve. This approach allows us to extract V05, V50, and V95 from the same dataset and to calculate statistically defined confidence bounds around those values.
The mathematics behind this transformation is well established and enables estimation of perforation probability at any velocity within the tested range. More importantly, it allows us to quantify uncertainty. That uncertainty becomes critical when assessing real safety margins rather than nominal performance.
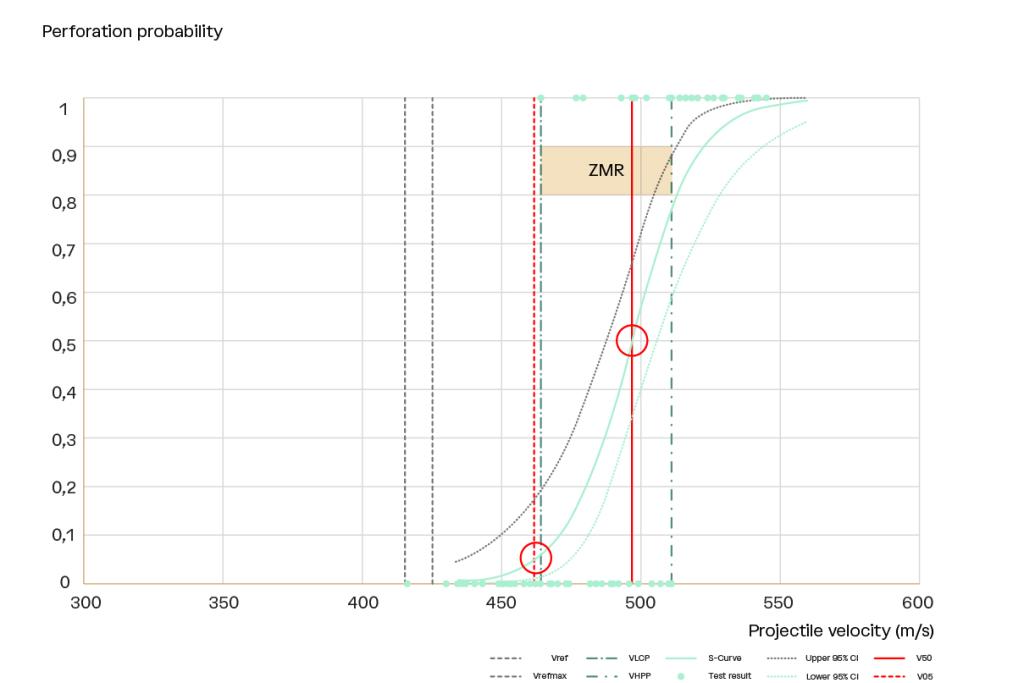
Fig 1. A typical S-curve with 95 percent confidence intervals and the Zone of Mixed Results.
The full regression modeling, confidence boundary evaluation, and conditioning datasets underlying these findings are detailed in our comprehensive research paper.
Our analysis demonstrates that the statistical uncertainty associated with V05 is inherently greater than that of V50. Estimating performance at the 5 percent probability level requires sufficient data in the lower velocity region, where complete perforations occur less frequently, and confidence intervals widen. Without adequate sampling in this range, the calculated safety margin may be overstated.
This is why evaluation of the full S-curve is essential. Its slope, confidence bounds, and Zone of Mixed Results together define how stable the system behaves within the certified velocity window. Two armor systems may present similar V50 values yet differ substantially in curve steepness and V05 position, resulting in different levels of predictability.
V50 indicates a ballistic threshold. The S-curve, and particularly V05 within its confidence interval, defines the reliability envelope. Assessing that envelope requires a probabilistic view of performance across the entire velocity range, not just a single midpoint value.
Assessing ballistic performance
Once the probabilistic framework is established, the question becomes practical. How do we interpret the S-curve when evaluating or designing an armor system?
Beyond V50 and V05, several measurable indicators provide additional resolution:
VLCP (Velocity of Lowest Complete Perforation)
The lowest velocity at which a complete perforation is observed. A higher VLCP suggests greater resistance to increasing energy levels.
VHPP (Velocity of Highest Partial Perforation)
The highest velocity at which the system still prevents complete perforation. This defines the upper boundary of consistent stopping behavior.
ZMR (Zone of Mixed Results)
The velocity interval between VLCP and VHPP where complete and partial perforations alternate. Within this region, performance outcomes are inherently variable. The width of the ZMR directly reflects the slope of the S-curve. A narrow ZMR corresponds to a steep transition from stopping to perforation. A wide ZMR indicates a gradual transition across a broader velocity range.
This distinction carries operational consequences. Two systems may share the same V50 yet exhibit different ZMR widths. The system with a wide ZMR introduces greater variability in outcomes within the certified test velocity window. The system with a steep curve confines that variability, resulting in tighter statistical bounds and more predictable performance.
In environments where impact velocities fluctuate and cannot be controlled, predictability is not secondary to resistance. It is integral to it. Evaluating VLCP, VHPP, and ZMR alongside V05 allows a more disciplined comparison between armor constructions and exposes differences that a single midpoint value cannot reveal.
Comparison of armor systems
Figure 2 compares two armor systems with identical V50 values. At first glance, both appear equivalent in ballistic efficiency. However, their S-curves reveal different reliability profiles.
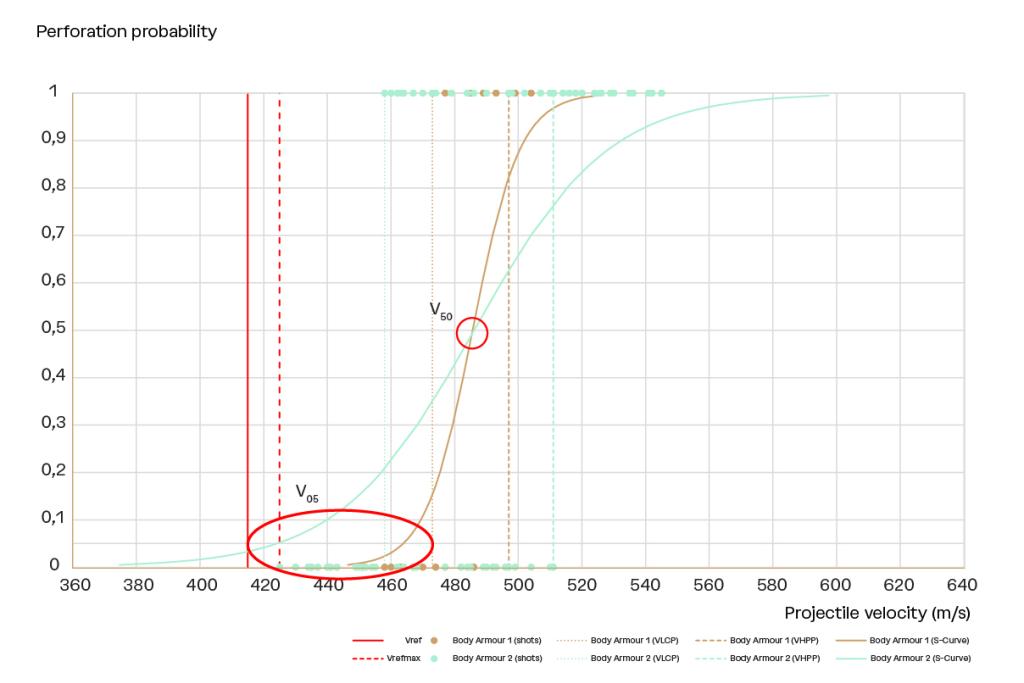
Fig 2. S-curve for two different sets of armor showing test velocities typically used for 9 mm DM41.
The yellow system exhibits a steeper curve and a narrower Zone of Mixed Results. Its V05 remains above Vref max, preserving a defined safety margin near the specification limit. The blue system, by contrast, shows a flatter transition, hence the V05 falls below Vref max, placing a greater risk of complete perforation inside the required test velocity window.
Influence of Mechanical Stress
The difference becomes more pronounced when mechanical stress conditioning is introduced. Data presented at PASS 2023 demonstrated that mechanical stress does not necessarily shift V50 proportionally. Instead, it can alter the shape and position of the probability curve itself. It is important to note that the probability curves and performance behaviors shown in this article reflect only the specific materials and constructions evaluated in this study. The observed performance is not necessarily indicative of all aramid and PE materials or armor systems.
After NIJ 0101.06 tumble conditioning and testing with 9mm DM41 projectile:
- Twaron® CT612LS woven construction showed no meaningful change in V05.
- Twaron UD exhibited a V05 reduction of approximately 8.8 percent.
- UHMWPE UD1 exhibited a V05 reduction of approximately 36.7 percent.
- UHMWPE UD2 exhibited a V05 reduction of approximately 26.7 percent.
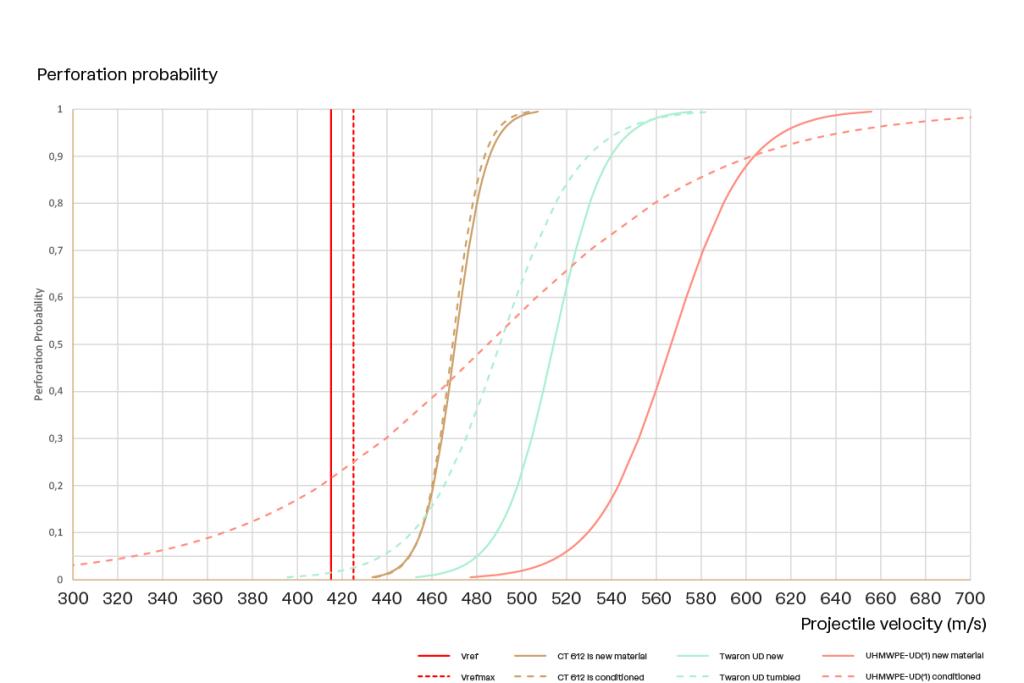
Fig 3. S-curves for Twaron® CT612LS woven fabric, Twaron® UD and UHMWPE UDs before and after tumbling
V05 reductions of this magnitude reflect a widening of the ZMR between partial and complete perforation. Even where V50 remains comparatively high, the amount of perforations increases in the lower velocity regime, compressing or eliminating the original safety margin.
This is where statistical analysis becomes operationally relevant. Two systems that appear equivalent at V50 in their initial condition may diverge significantly after aging or mechanical stress. A system that preserves curve steepness maintains predictability. A system that experiences disproportionate V05 degradation increases the likelihood of perforation within the required test velocity window.
The implication is direct: evaluating armor systems requires examining not only midpoint V50 resistance, but also curve stability under conditioning. Long-term reliability is defined by how the probability distribution evolves, not by a single nominal value.
A more complete view of armor performance
V50 remains an important reference for comparing ballistic efficiency. It quantifies energy absorption and provides a common benchmark across materials and constructions. But it represents only the midpoint of a probabilistic transition.
What ultimately defines performance is where that transition begins, how abruptly it occurs, and how stable it remains under mechanical and environmental stress. V05 relative to Vref max determines the available safety margin. ZMR width reflects predictability. Curve stability under conditioning reveals whether that predictability endures over time.
When these elements are examined together, differences between systems that appear equivalent at V50 become visible. The probability curve exposes not just how strong an armor solution is, but how predictable it remains across the full velocity range and throughout its service life.
Download
Explore the complete analysis
The full regression modeling, confidence boundary evaluation, and conditioning datasets underlying these findings are detailed in our comprehensive research paper.